Tokyo 23 Wards: Average Property Price per Square Meter & Market Trends | 2026
Last Updated: March 26, 2026
Tokyo 23 wards average price per square meter 2026 forecast: Explore trends in residential and luxury property prices, rising demand in central wards, and market projections for Tokyo real estate.
Table of Contents

Supervised By: Hiroki Kazato
Are you curious about how property prices in Tokyo’s 23 wards have changed over the past few decades?
Do you want to know where the average price per square meter in Tokyo is heading in 2026?
In this article, we analyze historical data, current market trends, and future projections for Tokyo real estate prices. From long-term growth patterns to short-term forecasts, you’ll gain a clear understanding of how property values across Tokyo’s 23 wards are evolving.
If you are considering investing in Japanese real estate, staying informed about average property prices and market trends is essential. Whether you are a local buyer or an overseas investor, understanding the Tokyo property market can help you make smarter, data-driven decisions.
Read on to discover expert insights into Tokyo property price trends for 2026 and beyond.
Read more about Tokyo Real Estate Outlook 2026:
🔗 Tokyo Real Estate Outlook 2026: Market Trends and Investment Forecast 🔗
1. Average Property Price per Square Meter in Tokyo 23 Wards: Current Market Conditions
A) Long-Term Land Price Trend
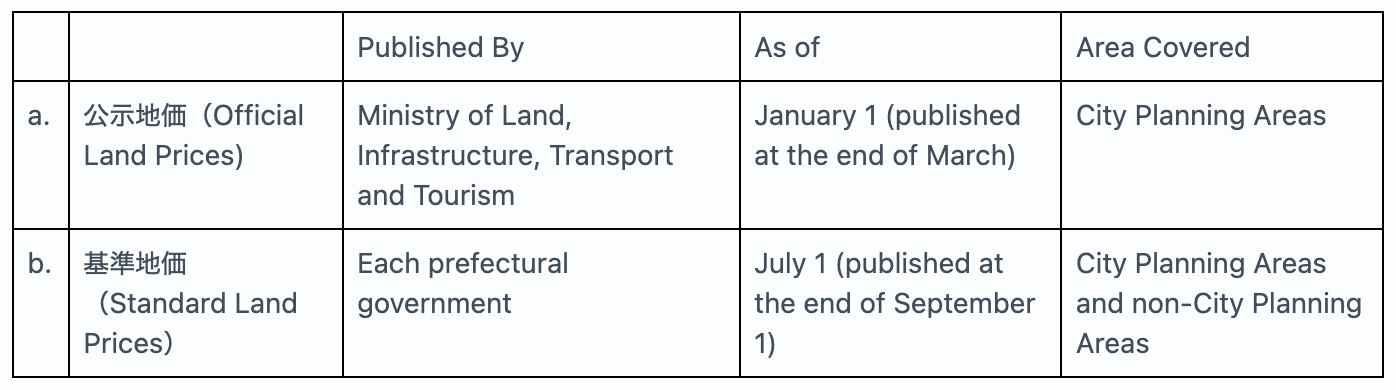
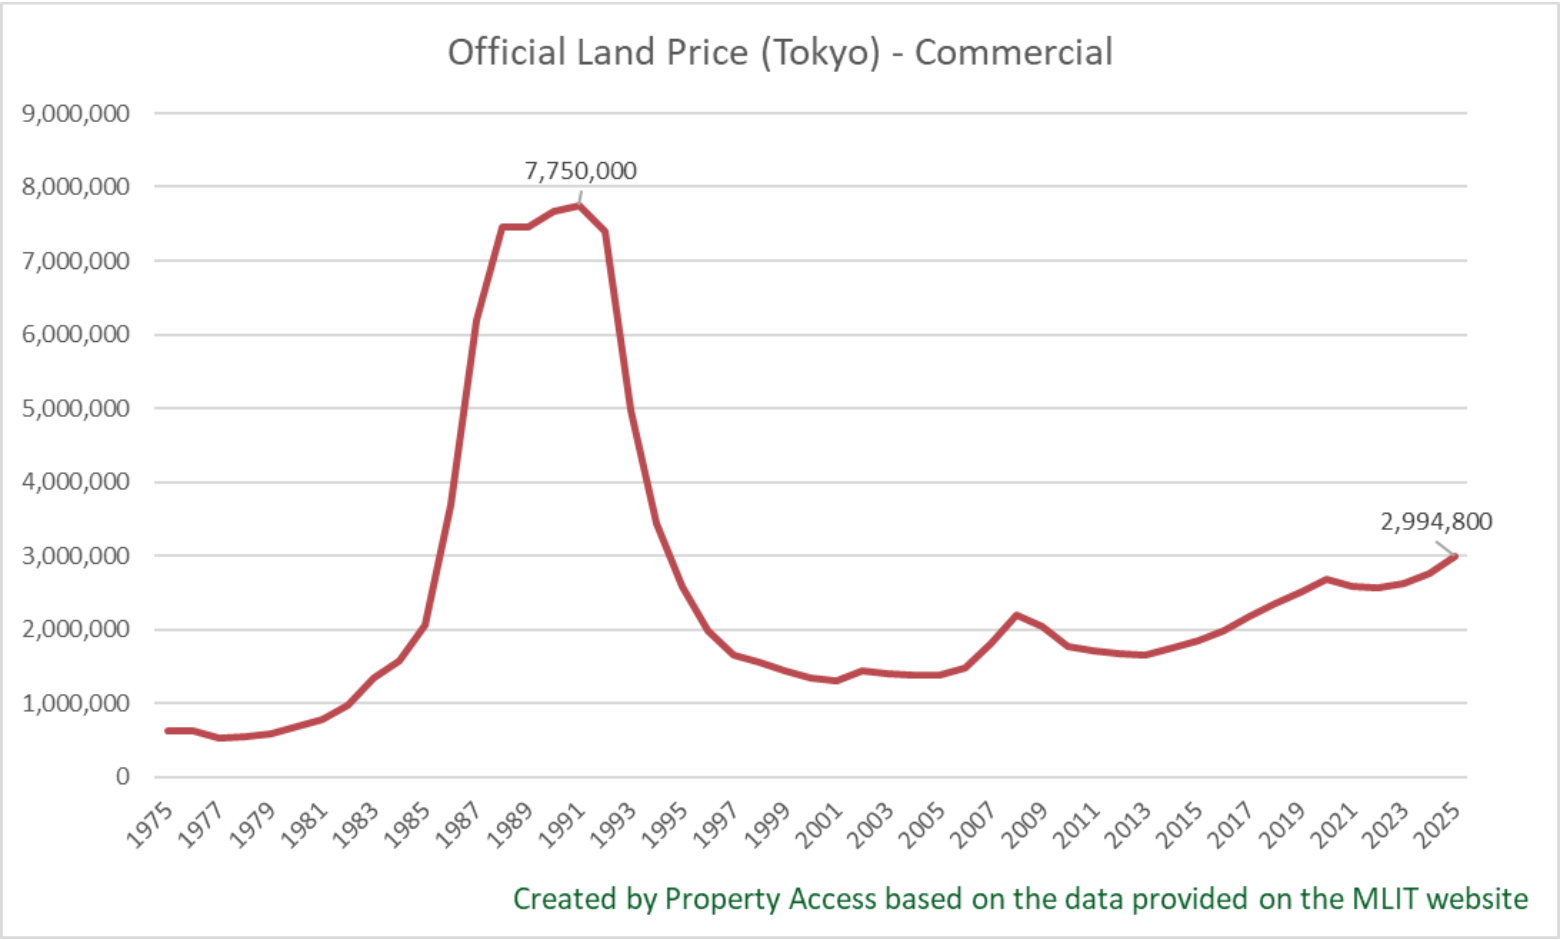
We will now examine the long-term trend in land prices. Japan has two types of official land prices; here, we will utilize the Official Land Prices published by the Ministry of Land, Infrastructure, Transport and Tourism (MLIT).
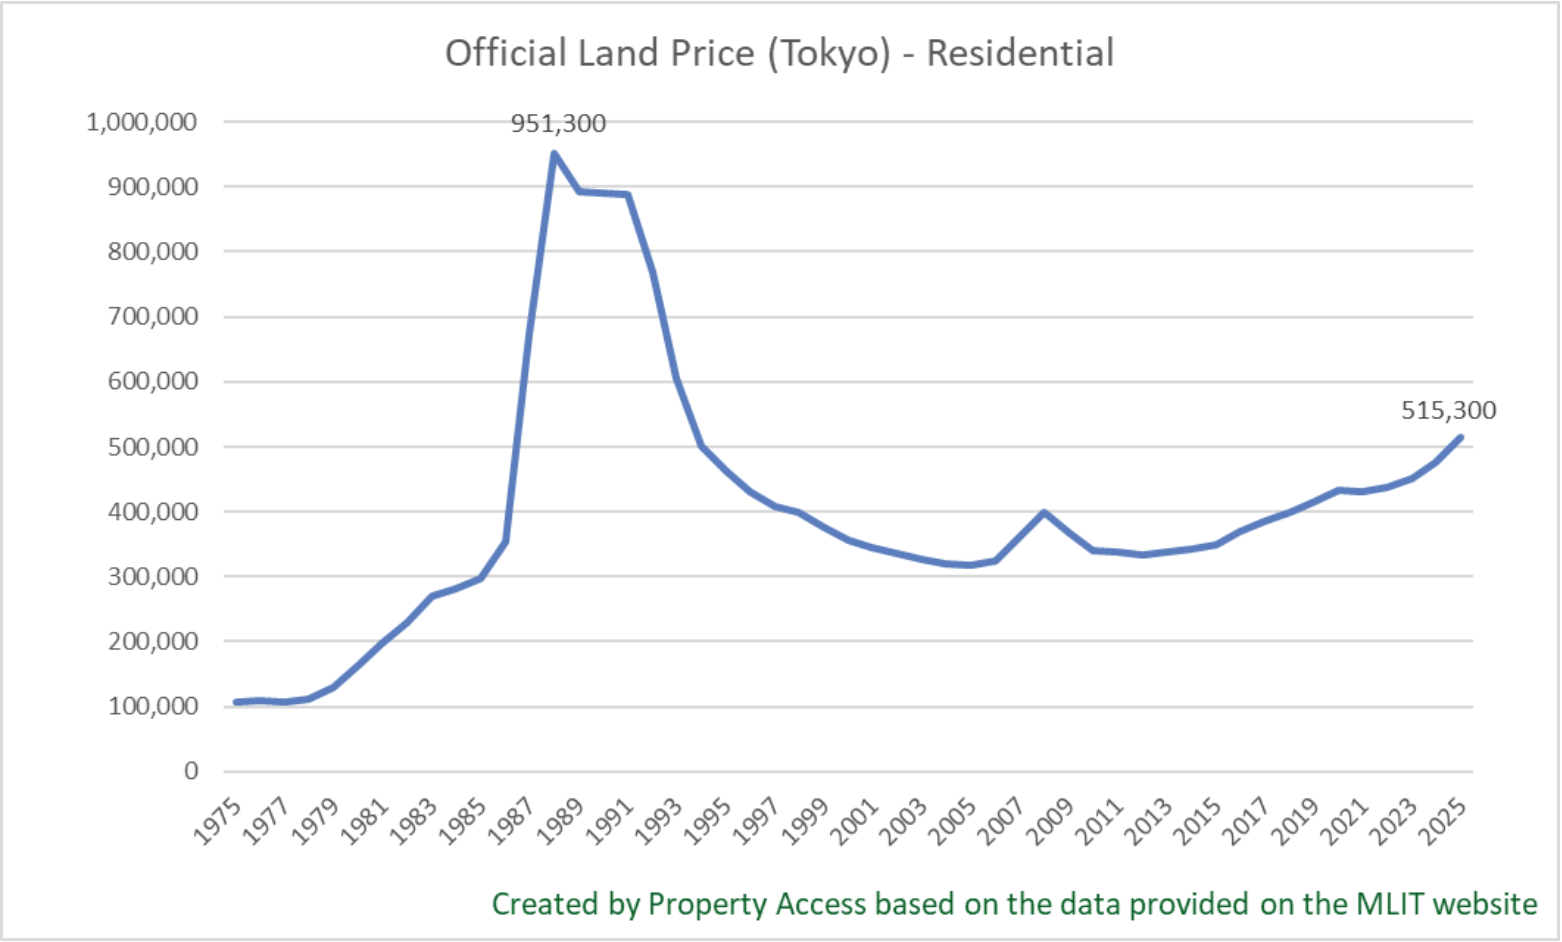
During the so-called Bubble era (1983–1991), Tokyo commercial land peaked at 7,750,000 yen/sqm in 1991 and residential land peaked at 951,300yen/sqm in 1988.
<Tokyo 23 Wards Average Land Price Index (1983=100)>
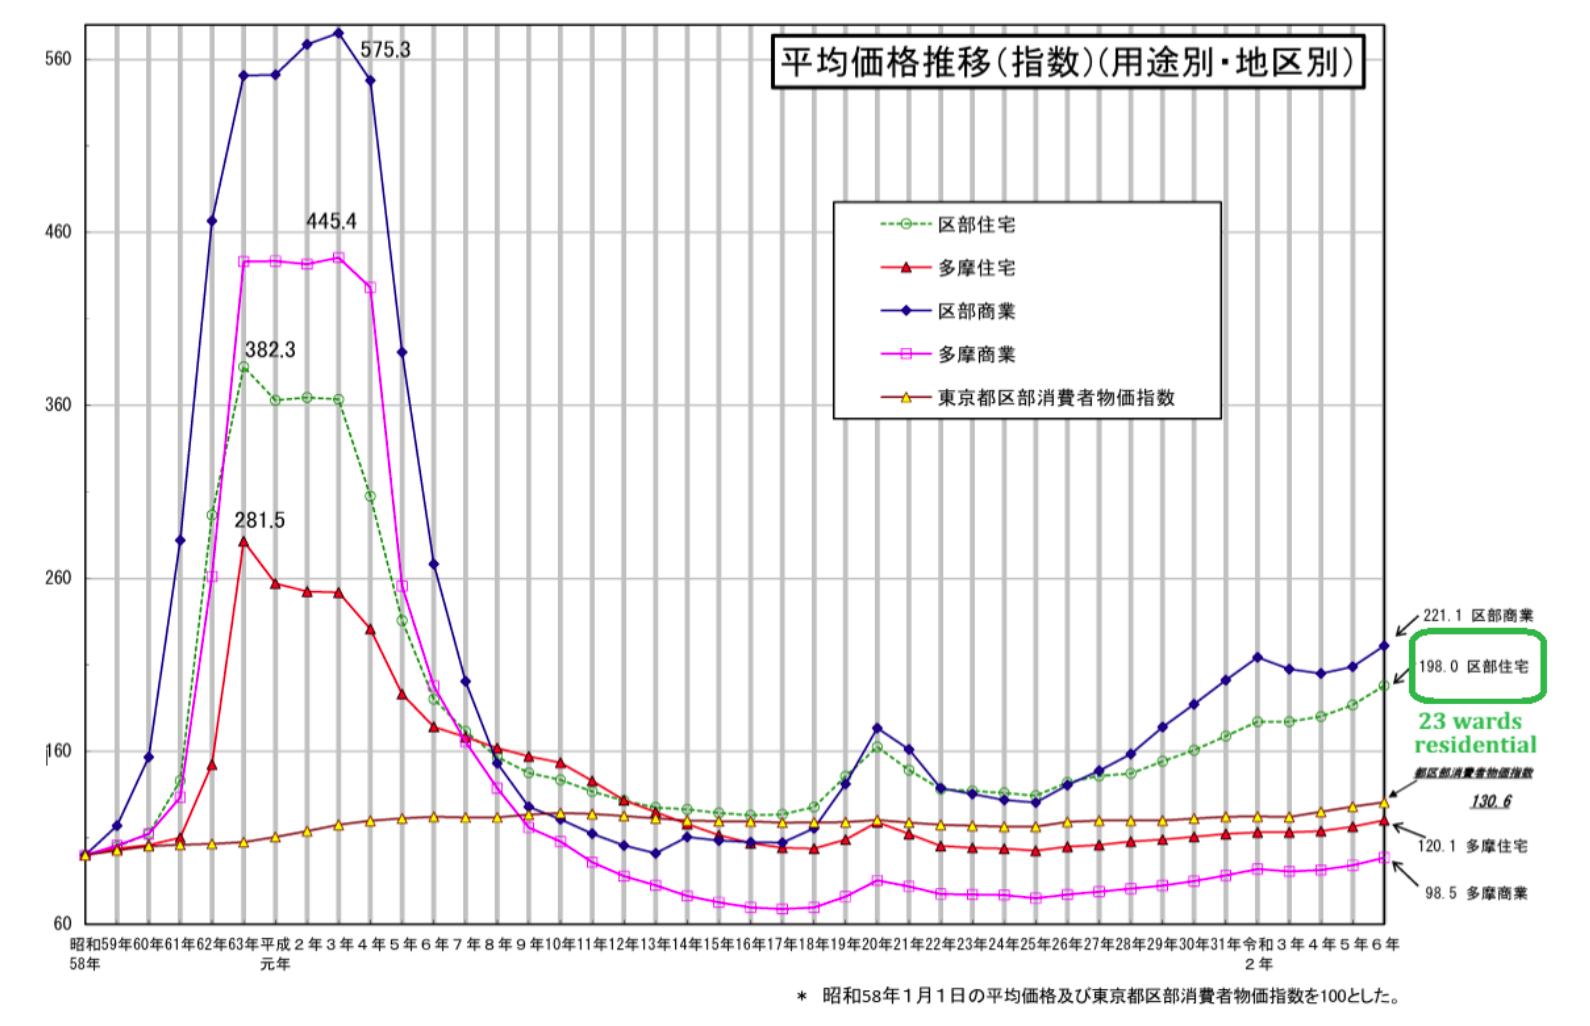
If we look at the average residential land price index in Tokyo’s 23 wards, it follows the same trajectory as the overall Tokyo index and peaked in 1988.
After the asset bubble collapsed in 1990, land prices generally declined or stagnated throughout the 1990s and 2000s, without experiencing a significant rise until the 2010s.
However, prices have shown an upward trend from the 2010s into the 2020s.
Recent data show a sharp uptick since the mid-2010s as Tokyo recovered and demand strengthened.
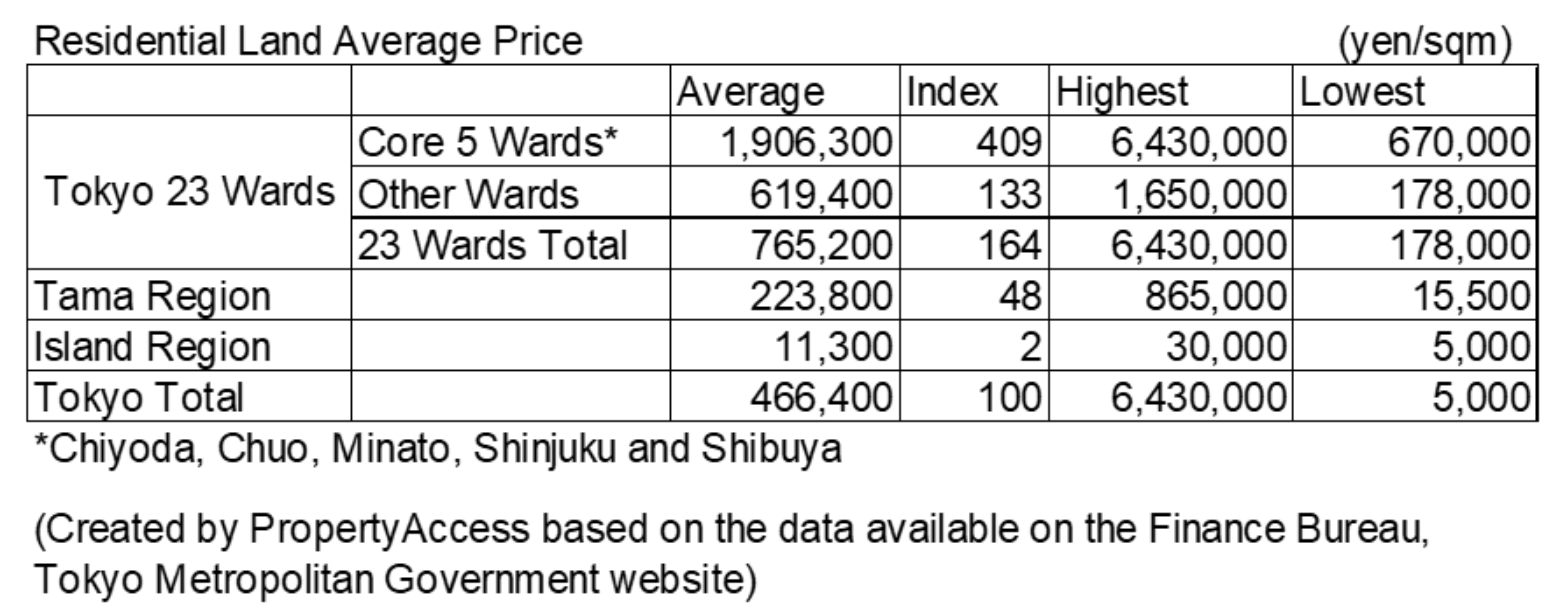
For 2025, the average residential land price in Tokyo’s 23 wards is 765,200 yen/sqm; however, prices vary by location, with the five central wards (namely Chiyoda, Chuo, Minato, Shinjuku, and Shibuya) recording the highest price at 6,430,000 yen/sqm.
B) Condominium / Apartment Price Trend
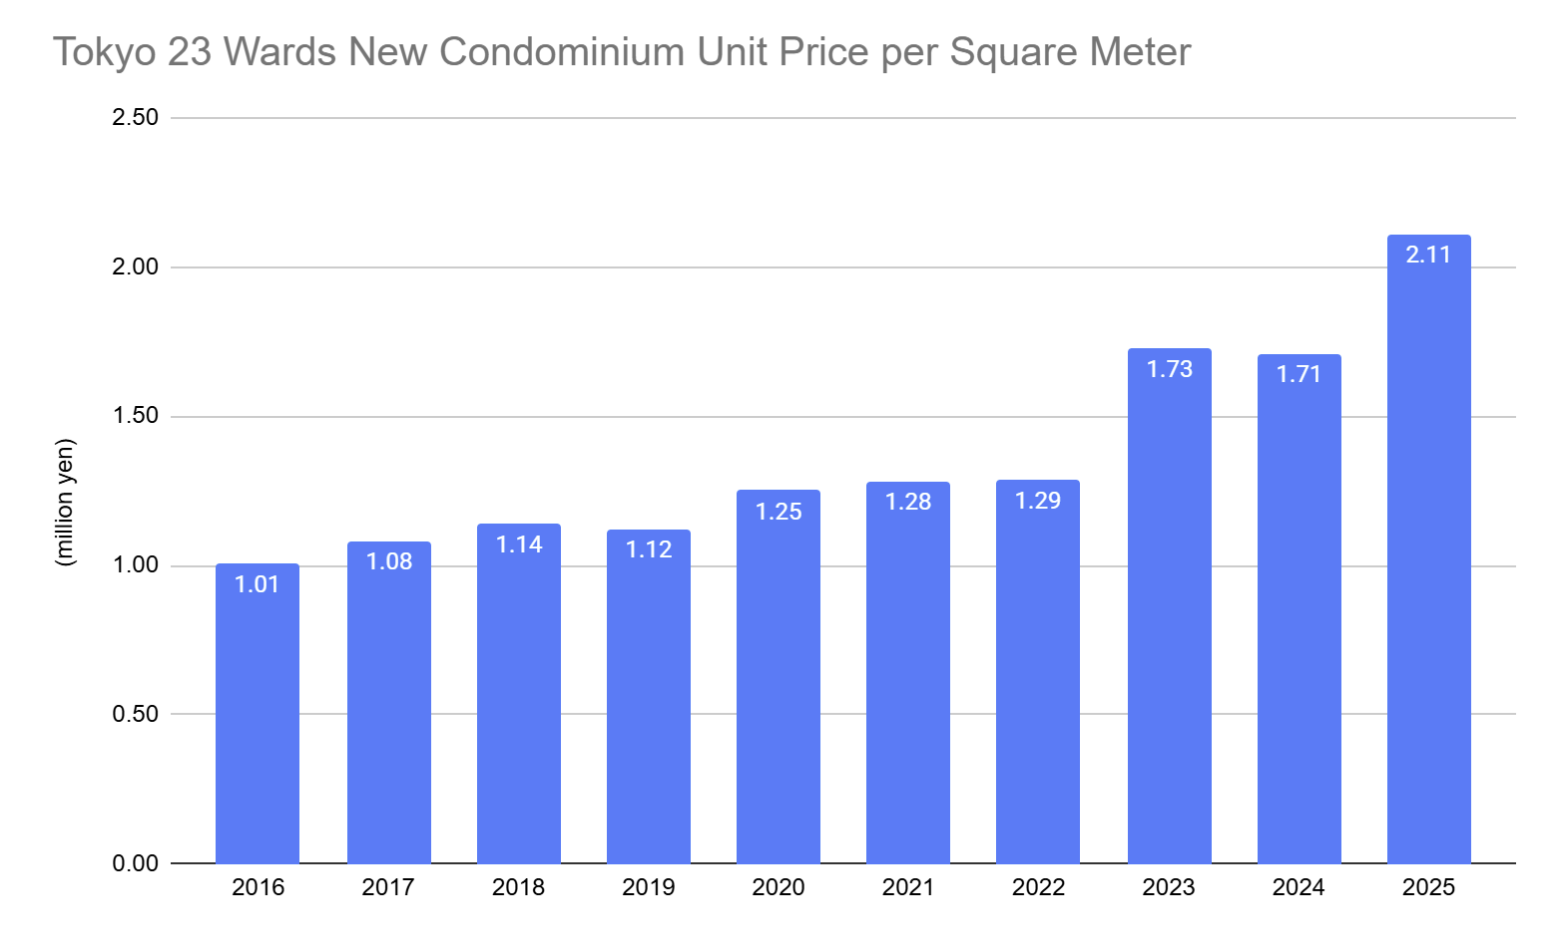
According to the latest survey, the Tokyo 23 Wards recorded an average price of ¥136.13 million and ¥2.109 million per square meter, representing significant year-on-year increases of 21.8% and 23.3%, respectively.
In the Tokyo suburban area, the averages were ¥66.99 million and ¥1.058 million per square meter (up 13.7% and 18.9%).
Kanagawa Prefecture saw averages of ¥71.65 million and ¥1.082 million per square meter (up 11.4% and 10.3%), while Saitama Prefecture recorded ¥64.20 million and ¥962,000 per square meter (up 15.8% and 13.3%).
In Chiba Prefecture, the figures stood at ¥58.42 million and ¥825,000 per square meter, marking more moderate increases of 2.7% and 2.0%.
Overall, prices are clearly on an upward trend, with the Tokyo 23 Wards continuing to drive the market.
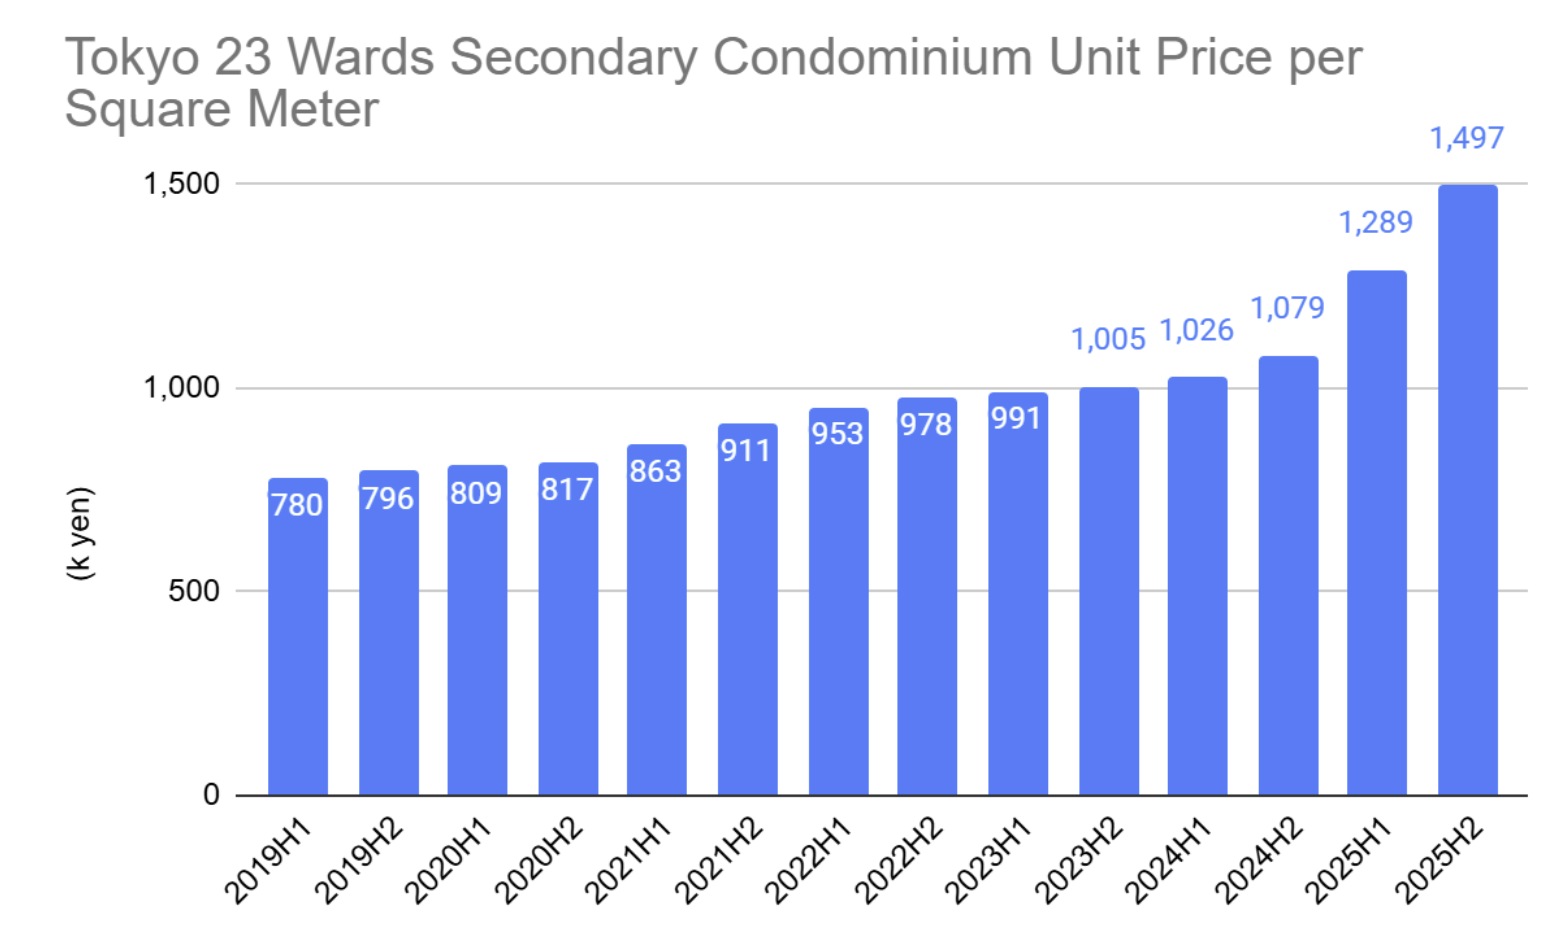
Secondary (used) condominium unit prices have also been rising.
As of December 2025, the price of secondary condominium units in Tokyo’s 23 wards rose for the 20th consecutive month, reaching 119.6 million yen, up 4.1% from the previous month.
The press release by Tokyo Kantei explains that this increase is due not only to a steady underlying trend but also to the growing number of newly listed, relatively new properties, with the impact being particularly pronounced in central urban areas.
Overall, year-over-year increases have continued in both the new property and secondary markets, with the central wards consistently showing much higher prices than the outer wards.
2. Tokyo 23 Wards Real Estate Price Forecast for 2026
Demand for centrally located properties, especially in the luxury segment, remains the main force pushing prices higher. With limited supply and a steady flow of people moving into Tokyo, upward pressure on prices is likely to continue.
Official land price data has shown consistent annual increases through 2025, which historically tends to lead transaction price growth.
Given that the market has been on an upward trajectory since 2013, the broader trend still appears intact.
Highly convenient central wards such as Minato, Chuo, and Shibuya, along with major redevelopment zones, are expected to remain particularly resilient in 2026.
That said, while strong demand and rising land and construction costs are supporting prices, the potential for higher interest rates could moderate the pace of growth.
The gap between central and outer wards also remains striking. In prime areas like Minato, Chuo, and Chiyoda, average prices per square meter are more than four times higher than in outer districts.
Condominium prices reflect both soaring land values and elevated construction costs, and the growing concentration of high-end developments is further lifting overall averages.
A weaker yen, relatively low borrowing costs through much of the 2020s, and continued foreign investment have also played an important role in strengthening demand in Tokyo’s prime residential market.
Summary
Tokyo's residential land prices in the 23 wards have experienced a substantial resurgence, particularly since the 2010s, following a prolonged period of stagnation that lasted through the 1990s and 2000s after the collapse of the Bubble era (1983–1991) highs.
By 2025, the five central wards had significantly outpaced the outer areas. Similarly, both new and secondary condominium prices have seen sharp increases, with the 23 wards consistently leading the market with robust year-on-year gains.
Looking ahead to 2026, the central wards, especially the luxury segment, are anticipated to maintain strong demand.
Price increases are likely to remain firm due to factors such as limited supply, ongoing migration to Tokyo, foreign investment, and escalating land and construction costs.
While the overall upward trend is expected to continue, the pace of growth could slow if interest rates increase.
Our team of seasoned professionals at Property Access is dedicated to helping you navigate Japan’s real estate market with confidence.
With deep local knowledge and a commitment to personalized service, our experts are here to guide you every step of the way.